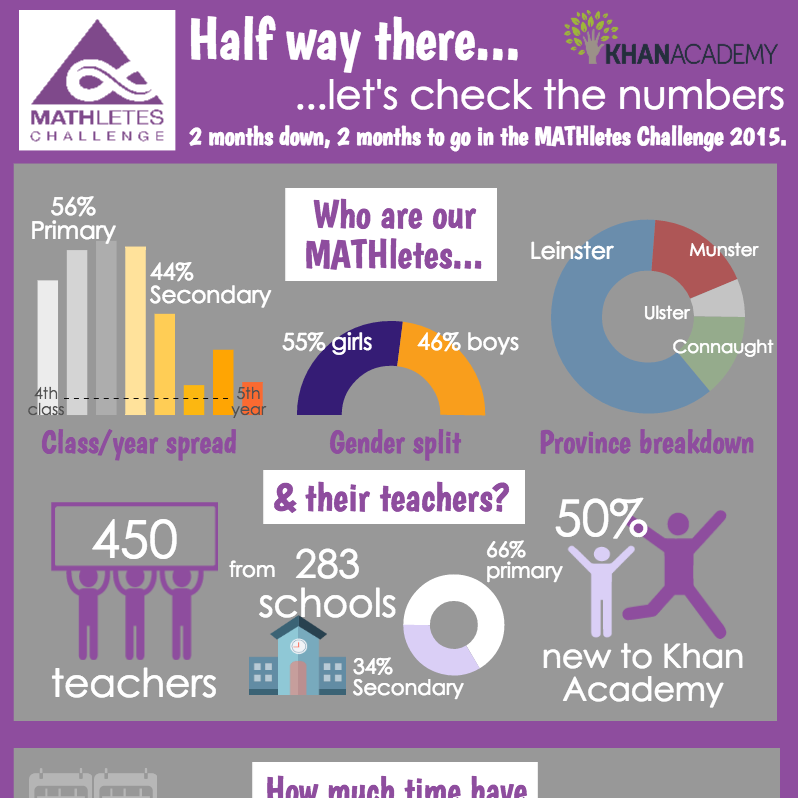
Infographic: February Cup Stats
2 months into the MATHletes Challenge 2015 12,000 students & 280 schools have spent over 2 million minutes learning maths on Khan Academy. Check out all the stats on signups, engagement & learning in the infographic below!
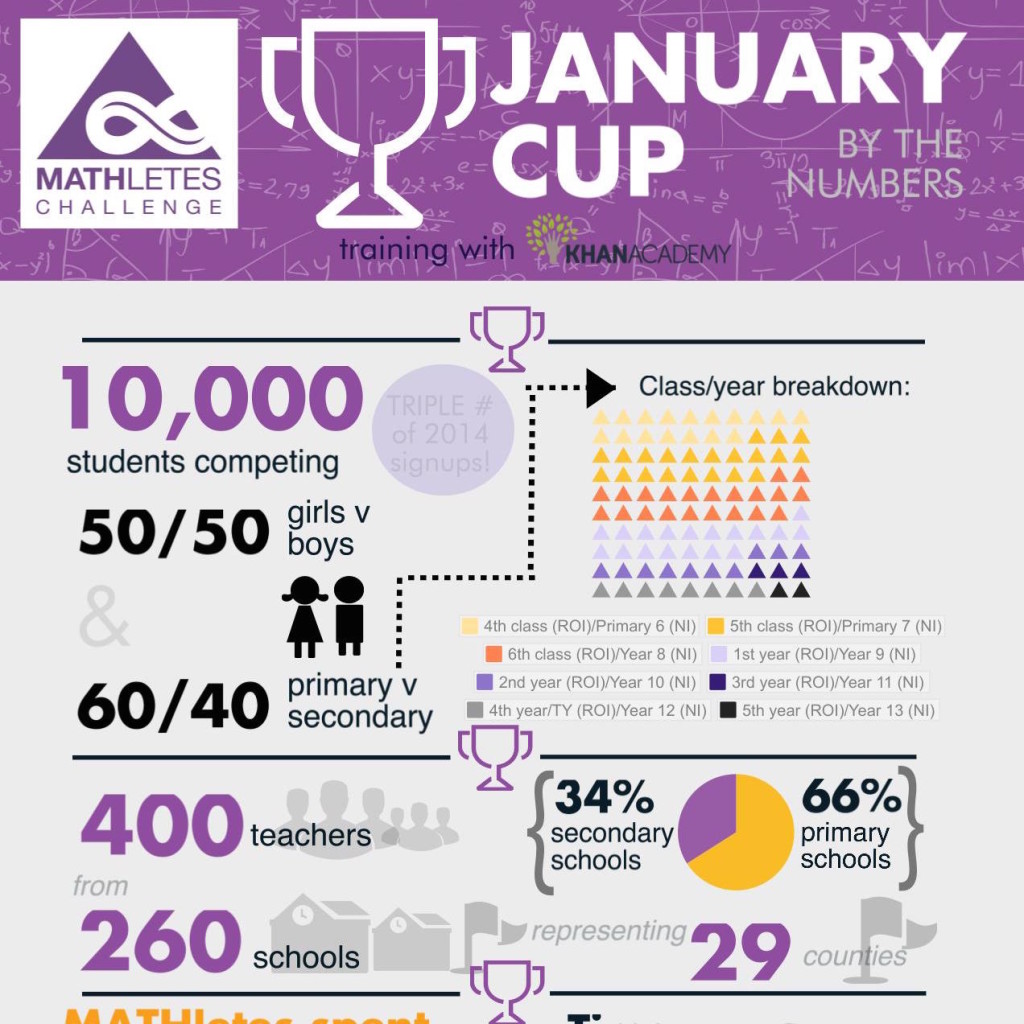
Infographic: 2015 January Cup Stats
10,000 students spent over 1.1 million minutes learning maths on Khan Academy in the first month of the 2015 MATHletes Challenge, more than half of which was spent out of class. Check out all the stats on signups, engagement & learning in the infographic below!